| Your Dev Process
GoalPath is the development process your team follows — not a blank canvas you have to figure out. Backlog to delivery, guided by the interface.
30-day free trial • No credit card required • See pricing
How it works
From backlog to delivery in four steps
No migration project. No training sessions. Your team opens GoalPath and follows the interface.
Plan
The interface walks you through backlog organization — create milestones, drag to prioritize, estimate to forecast. No process wiki needed.
Structured backlog, milestone planning, dependency mapping — guided by the interface.
Execute
Track work on the board. GoalPath shows what's on track and what's slipping — and guides you when priorities shift.
Kanban board, flow tracking, automatic velocity — no spreadsheets needed.
Forecast
Monte Carlo simulations generate 3-point delivery dates — best case, expected, and risk-adjusted — updated continuously from your actual throughput.
Data-driven forecasts that update themselves. Not guesses from a planning meeting.
Align
Stakeholders get automatic updates as a byproduct of your workflow — not a separate task you have to remember.
No meetings required. No Agile knowledge needed. Just shared reality.
A development process, not a blank canvas
Traditional tools make you document “how we work” separately. GoalPath embeds lean delivery methodology directly in the interface — so your team follows the right process without needing a wiki.
What changes when your process is built into the tool
Before GoalPath
- • Document your process in Confluence
- • Train every new hire on “how we work”
- • Manually enforce the workflow
- • Process breaks when someone leaves
- • “Where are we?” Slack messages
With GoalPath
- • Process is the interface — no docs to write
- • New hires follow the tool on day one
- • Workflow enforces itself
- • Process survives team changes
- • Stakeholders get updates as a byproduct
Visual roadmap
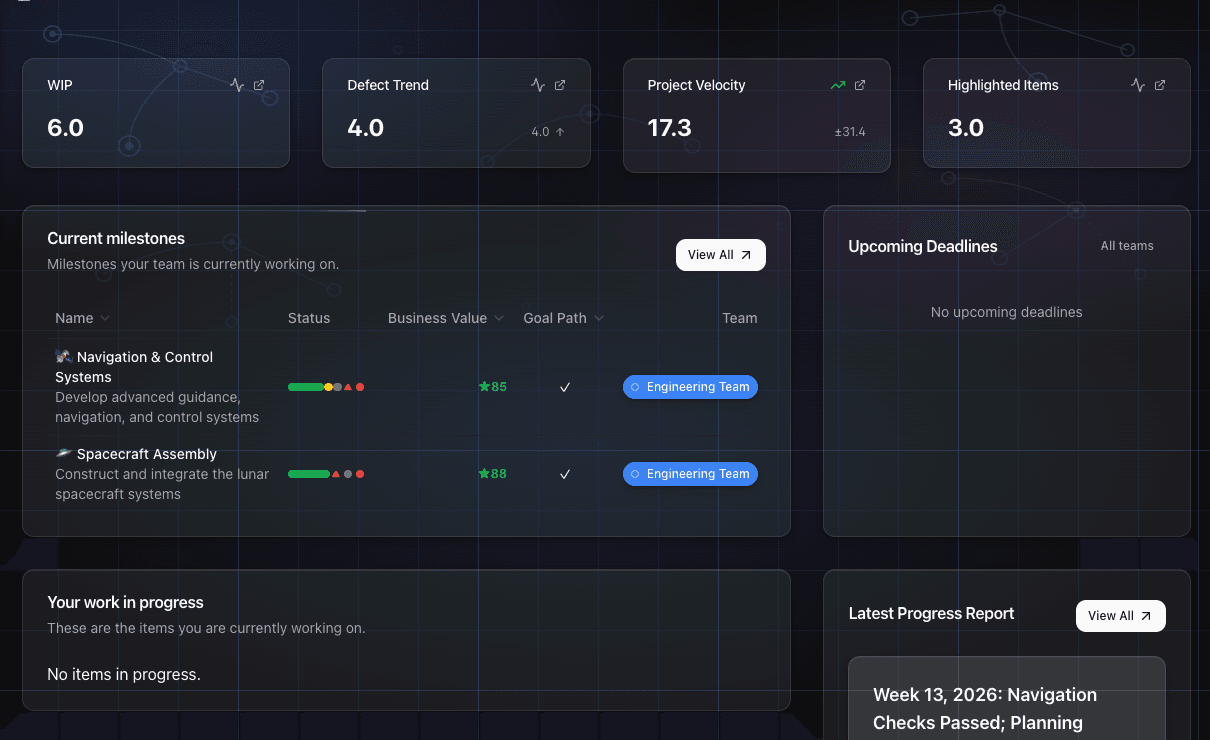
Roadmaps that show the path, not just the wish list
See dependencies, progress, and the critical path toward your goals. Not a decorative timeline — an executable map.
One tool instead of five
Same team. Same work. A process that actually works.
The blank-canvas approach
Open Jira. Three tabs, two stale filters. Check the Confluence page for “how we use this tool.”
Open the roadmap spreadsheet. It's outdated. Spend 20 minutes updating it. Nobody trusts the dates.
New engineer asks “what should I work on next?” You explain the process for the 4th time.
Stakeholder asks for a delivery date. Pull velocity data into a spreadsheet. Still feels like a guess.
Finally start actual work.
The process lives in your head. When you leave, it leaves with you.
The guided approach
Open GoalPath. The interface shows priorities, what's blocked, and what to do next.
Move a card, update status. Velocity and forecasts update automatically.
Stakeholders already have this week's update — it drafted itself from your actual work.
Start shipping. No alignment overhead. The process just works.
The process lives in the tool. New hires follow it on day one.
No wiki. No training sessions. No process police.
Built for teams who ship
A development process, not a blank canvas
The interface IS the methodology. No wiki, no training, no consultants.
Not guesses from a planning meeting
They follow the interface. The process survives team changes.
“Most teams don't fail due to lack of execution—they fail because the process lives in someone's head instead of the tool. When that person leaves, the process leaves with them.”
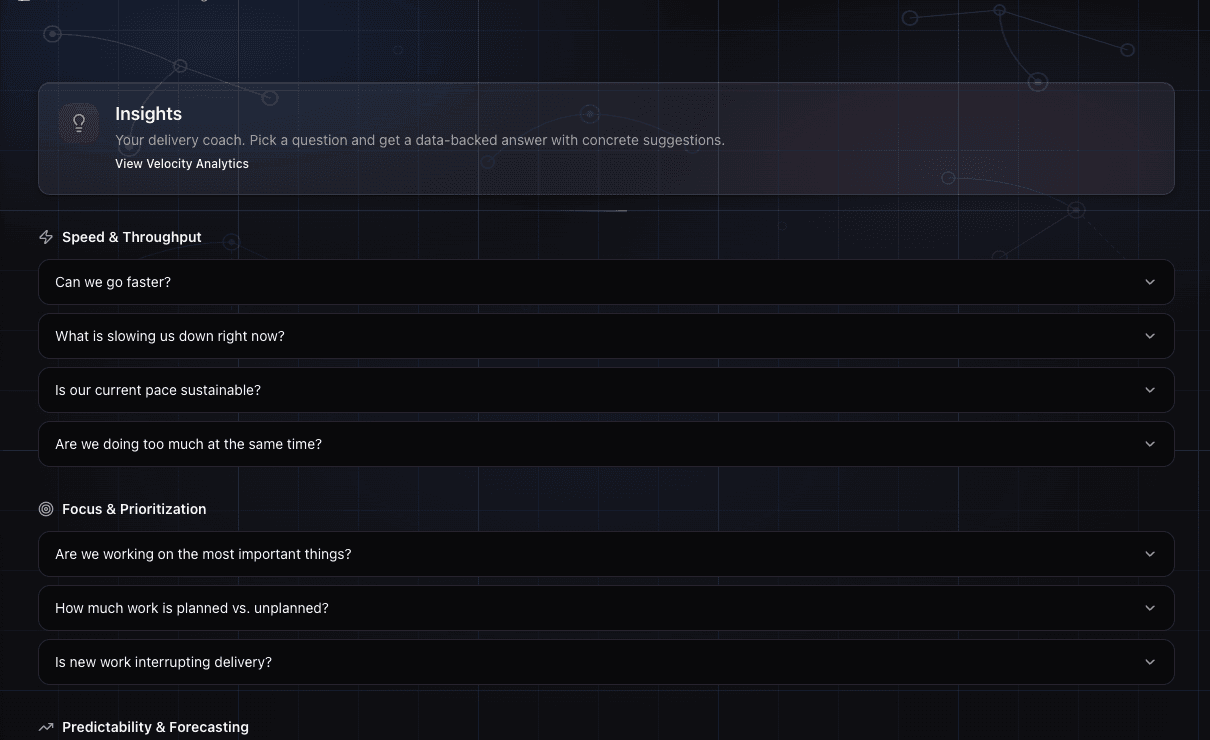
From the blog
Insights for teams who ship
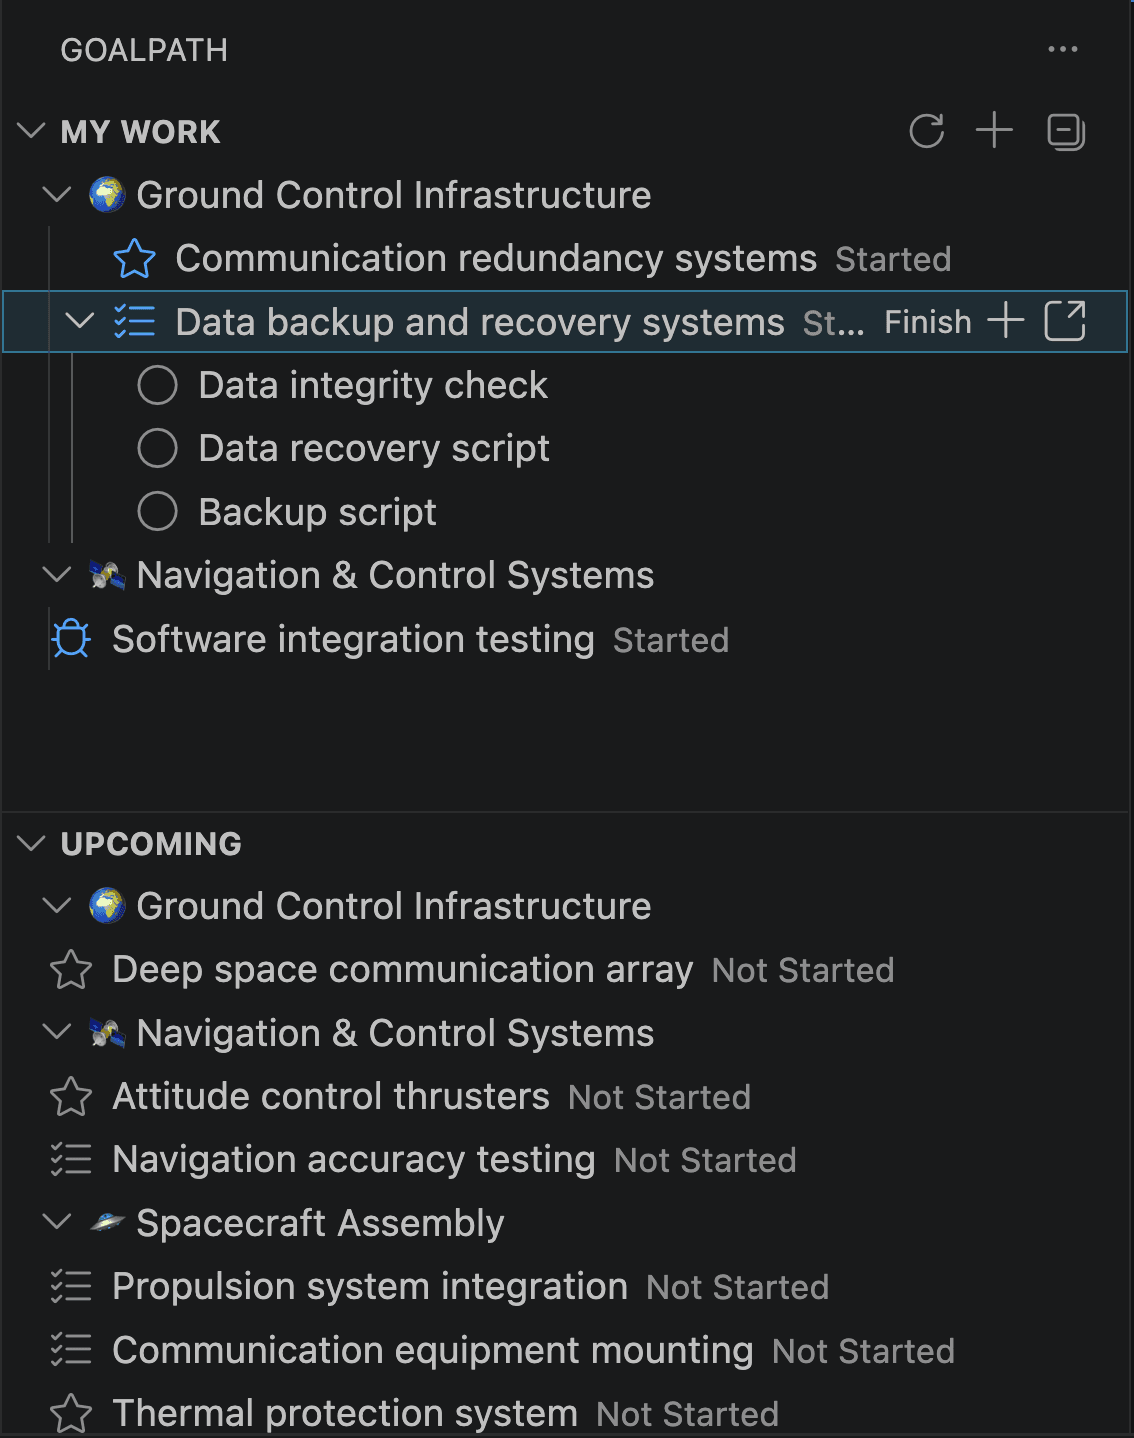
Your task list, right where you code
GoalPath's VS Code extension puts your assigned items in the sidebar. Progress status, check off subtasks, flag blockers, all without opening a browser tab.
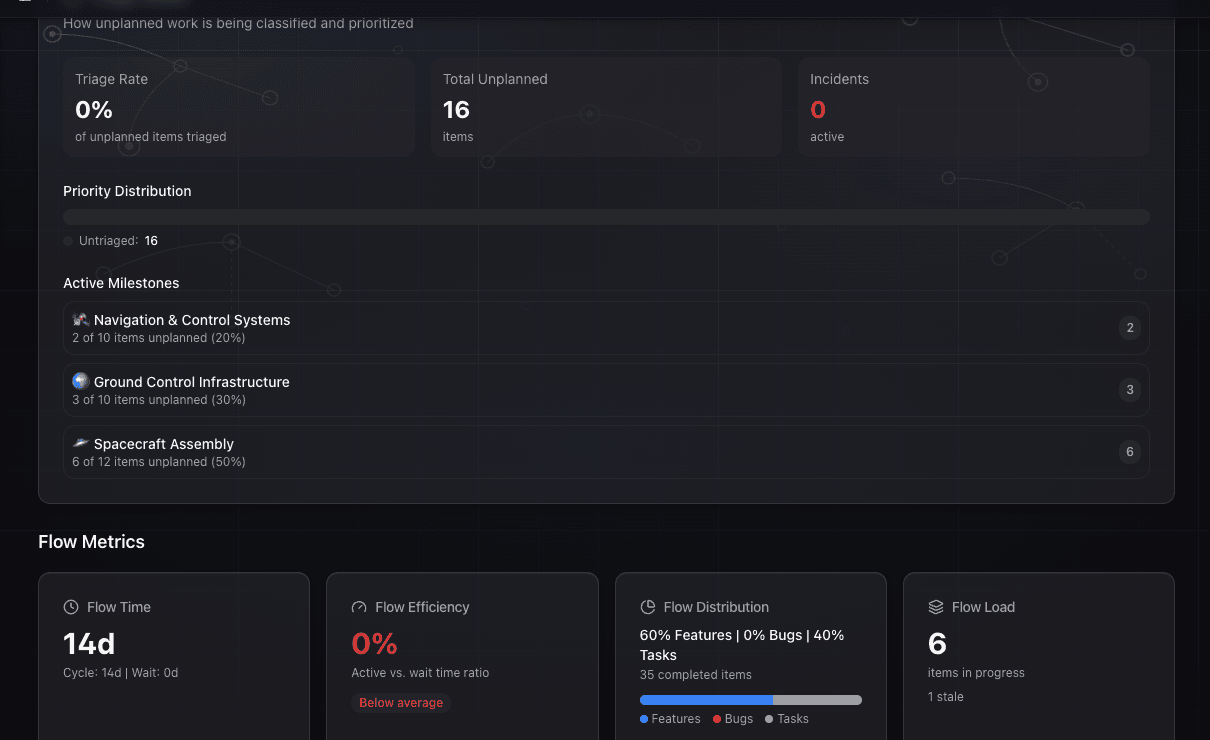
Cumulative flow and statistical process control for delivery
How to read a cumulative flow diagram, what the bands tell you about WIP and throughput, and how GoalPath's built-in CFD and flow metrics give you diagnostic power without setting up external tools.
The SPACE Framework: Beyond Throughput
Velocity and story points only tell you part of the story. The SPACE framework explains why developer productivity needs five dimensions, and which three GoalPath measures automatically.
Theory of Constraints for software delivery: find your bottleneck before hiring more people
Most teams try to speed up delivery by adding capacity or running faster everywhere at once. Theory of Constraints says that's almost always waste. Here's how to find the one constraint that actually limits your throughput, and how GoalPath's flow data makes it visible without hiring a consultant.
DORA Metrics: Engineering Performance Benchmarks
What the four DORA keys actually measure, what Elite performance looks like in practice, and how GoalPath's flow metrics give you DORA-adjacent insights without a separate measurement tool.
Ready for a dev process that runs itself?
Stop building process from scratch with blank-canvas tools. Start with a guided workflow your team can follow from day one.
30-day free trial • No credit card required • Set up in 5 minutes
Common questions
How is this different from Jira or Linear?
Jira and Linear are blank canvases — they track work but don't guide the process. GoalPath embeds the methodology in the interface, plus adds forecasting and automatic stakeholder updates.
What if the opinionated approach doesn't fit us?
GoalPath is opinionated about workflow structure, not your content. You decide what to build and when — GoalPath guides how the process works.
Do we need to learn a new methodology?
No. The methodology is built into the interface. If you can drag a card and update a status, you already know how to use GoalPath.
Are we too small for this?
GoalPath is built for teams of 5-20 engineers. Big enough for process, small enough that heavyweight frameworks would slow you down.
Can this actually replace our PM tool?
Yes — backlog, board, milestones, dependencies, forecasting, and stakeholder updates. But you don't have to switch all at once. Start with what your current tools can't do.
How long does setup take?
5 minutes to create a project and first milestone. New hires follow the interface from day one — no onboarding the process separately.
Prefer to talk first?
Not ready for a trial? No problem. Tell us about your team and we'll reach out personally.